
Introduction
The role of Foreign Direct Investment (FDI) has been recognized as crucial towards enhancing the transfer of technologies, building human capital, creating employment, and stimulating overall economic growth (OECD, 2022, p. 16). Therefore, the knowledge of the determinants, which motivate Multinational Enterprises (MNEs) to allocate capital in specific locations, is vital towards creating policies, which establish attractive investment environments. For the past ten years inflows to Bulgaria have been gradually increasing, with the country benefiting from market-based reforms, trade liberalization, and political integration in the European Union (OECD, 2022). Since 2010 the country has reached its lowest level of FDI in 2014 (939 million), following an exponential rise in 2015 (1.9 billion), while remaining moderate until the Covid-19 pandemic (BNB, 2022). The year 2020 has marked the strongest period of foreign capital inflows for the last decade, reaching a distinctive high (2.3 billion) which is a 101% increase since 2010 (BNB, 2022). This indicates that despite the economic shocks caused by the pandemic, Bulgaria remains an attractive investment destination while many investors prioritize production outsourcing for their businesses (OECD, 2022).
The following paper offers an empirical analysis of the subnational factors, which encourage FDI inflows, while the emerging context in Bulgaria is taken as a case study for the analysis. As argued in the previous subnational (Dũng, BíchThủy and NgọcThắng, 2018; Goswami, 2023) and cross-country (Cazurra, 2008; Egger and Winner, 2005) studies, a key factor affecting FDI is the quality of domestic political institutions and their capability to collaborate with MNEs. Therefore, my paper focuses on the role of bureaucratic transparency in affecting the inward flows of foreign capital. Using district-level data on Bulgaria, which has been labelled the most corrupt country in the EU1, I aim to answer the following research question: “Does transparency impact FDI when institutional corruption is high?” In answering this question, I provide a theoretical interaction between a foreign investor and a host district that is governed by an administrative body. I argue that, as an outcome of the established norm that corruption is the way of conducting business (Traikova, Mollers and Buchenrieder, 2017) and the burdensome bureaucracy common to the transitioning economies, MNEs would invest in less transparent and more corrupt environments in accordance with the ‘helping hand’ hypothesis (Cazurra, 2008). To test this assumption, I used a series of Fixed Effects linear regression models while controlling for several measures important to FDI allocation. The results from my analysis indicate that investors do tend to invest in less transparent districts, presumably with the intention to circumvent the slow bureaucracy. The magnitude of this effect, however, is relatively small, and its significance across the models is not consistent; therefore, insisting on a cautious interpretation of the results. In addition, the study offers a substantial contribution with the evidence on the non-institutional factors (included as controls) which influence FDI on a subnational level.
The remainder of this paper proceeds as follows. Firstly, I discuss the relevant literature on the dominant theory employed by this research, namely the Corruption-FDI nexus. Also, I leave substantial space to assess the existing evidence and mechanisms explaining subnational FDI across various geographical regions. Furthermore, I elaborate on the studies on Bulgaria, which have shown to be limited with regards to subnational FDI. Secondly, I proceed by explaining the “helping hand” theory and how it can be applied in the context of Bulgaria, with a new approach of institutional transparency. Then, the collected data and method are described as well as the choice of variables in the research design. The final sections of this paper provide the results from the regression analysis and a discussion of the main findings concerning the independent variable of interest. The conclusion restates the findings and offers valuable insights for possible improvements on this study in future research.
Review of the Literature
The role which corruption plays on investment decisions of MNEs has been examined on a cross-national basis, with most of the studies employing econometric analysis to test what has been identified as the “helping” or “grabbing” hand of corruption. With relation to the helping hand, studies have established that illegal institutional practices create paths for decreasing the costs of dealing with an inefficient bureaucracy, especially into the transitioning economies (Barassi and Zhou, 2012; Cazurra, 2008; Egger and Winner, 2005; Gossel, 2018). For a panel of 30 Sub-Saharan African countries, Gossel (2018) found that corruption increases FDI as investors should deal with weak institutions. Nevertheless, the author has provided evidence that this effect is dependent on the level of democratization, meaning that with countries becoming more democratic investors no longer prefer to deal with corruption and cease to invest in such environments. With slightly different conclusions, Barassi and Zhou (2012) explained that corruption is an attractive mechanism for MNEs only in countries with already established high levels of FDI. Conversely, developing countries with low FDI could benefit from less corruption (Barassi and Zhou, 2012, p. 311).
The opposing grabbing hand framework from the Corruption-FDI nexus addresses the notion that corruption creates additional business costs and economic uncertainties to investors, resulting in an overall decline of FDI (Goodspeed, Martinez-Vazquez and Zhang, 2006; Habib and Zurawicki, 2001; Teixieira and Guimaraes, 2015). For example, using a research design with both developed and developing countries, Teixieira and Guimaraes (2015) found for a panel of 96 states that on average a bribe-free environment attracts more FDI, and the high perception of corruption decreases it. Similarly, another study by Cazurra (2008) established that corruption decreases FDI only when it is pervasive and widespread. On the other hand, low-level, arbitrary corruption in the emerging economies appeared to be a known cost for investors and they do not necessarily avoid it (Cazurra, 2008). Therefore, Cazurra (2008) suggested that MNEs account for the possibility of bureaucratic expropriation due to the poorly developed institutions, and thus, a negative effect in the empirical models was not observed.
One of the limitations in these studies is the over-reliance on aggregate measures such as the Corruption Perception Index (CPI)2 due to the absence of other reliable indicators. This paper addresses this issue by employing an entirely new measure for perceptions about corruption. It uses a transparency indicator showing accessibility to information, which is an approach that recent studies recognized as valuable for addressing the prevalence of corruption (Jeong, Shenoy and Zimmermann, 2023).
On the subnational level, previous literature has provided mixed results on the role of corruption towards MNEs decision-making. Furthermore, a wide array of alternative explanations for regional FDI allocation have been provided. For example, Goswami (2023) used a sample of 29 Indian states in the period 2000–2019 to illustrate that higher state-level corruption attracts more FDI, as investors allocated their funds in places where bribing the bureaucracy could save them time when conducting business. Conversely, Avioutskii and Tensaout (2016) used a cross-section analysis on a set of Polish provinces; reaching to no empirical conclusion that corruption affects FDI. Beyond the role of corruption, a case study on Mexican states by Garriga (2021) highlighted that left-leaning states receive larger inflows of new FDI because left political parties provide better opportunities for building human capital. Meanwhile Camarero, Montolio and Tamarit (2019) found evidence that in Spain the competitive ability of a region and the agglomeration effect are the primary factors driving investment. Overall, previous studies on the subnational determinants have exhaustively reached upon the significant factors attracting FDI. However, further evidence about the role of inefficient political institutions is required, especially in the context of the transitioning economies. Furthermore, as argued by Garriga (2021), the relative effects of subnational factors could be changing across countries; therefore, this essay builds on this by showing how variables used in the international literature relate to the context in Bulgaria.
Finally, to fully comprehend the available literature that is relevant to this research, it is vital to assess some of the existing studies on FDI that are focused on Bulgaria as a case study. Earlier studies such as Bitzenis (2003) used an interview analysis on 100 foreign companies operating in Bulgaria, once again with a focus on the post-Soviet transition period between 1989-1999. The study identified how the unsteady legal system, burdensome bureaucracy, corruption, and widespread organized crime constituted the main barriers for investment, according to the opinion of the interviewees (Bitzenis, 2003, p. 98). Those key contributions served as a basis for later research, but also motivated the topic of this paper as the flaws of the Bulgarian system were not endemic to the early nineties, but rather persisted throughout time. For instance, the rather limited in sample size but once again crucially important study by Glaister and Atanasova (2001), reflected similar results from an interview questionnaire on 9 foreign firms. Their paper offered a heterogeneous mix of companies specialising in oil exploration, manufacturing, and retailing; therefore, having a good exposure to various sectors. Overall, the study documents several location and resource related reasons for reinvestment in Bulgaria, with many respondents highlighting access to the Black Sea and raw materials as important determinants (Glaister and Atanasova, 2001). Furthermore, the interviewees indicated that low-level corruption in the form of bribe paying is distinctive to the domestic bureaucracy. While foreign business owners admitted they signalled for corruption activities to the authorities, this imposed additional costs to the enterprise in slowing down the rate of doing business (Glaister and Atanasova, 2001). This suggests that while inherently corrupt, the established system represents the rules of conducting business to which investors are enforced to comply with.
In relation to the more recent studies, Kostadinova and Neshkova (2012) estimated how political reforms on depoliticizing the civil service and increasing the bureaucratic transparency in 12 Central and Eastern European countries decreased the overall levels of corruption. The authors conducted a cross-country panel analysis including Bulgaria as an observation, establishing that institutional reforms decrease perceptions of corruption (Kostadinova and Neshkova, 2012). Additionally, lower bureaucratic regulation increased FDI as investors associated a heavy regulatory burden with more corruption, and therefore higher operational costs (Kostadinova and Neshkova, 2012). Those findings support the arguments made by Bitzenis (2003) and highlight how the administrative burden of non-transparency and prevalent corruption affects investors’ decisions. Another seminal paper on the region by Traikova, Mollers and Buchenrieder (2017) conducted a quantitative study on the corruption perceptions in rural Bulgaria. Their research used interview data only from Bulgarian investors, but the suggested findings are generalizable to the overall picture concerning the obstacles for entrepreneurial activity in the country. After a factor analysis using data between 2008–2009, the results show that in situations where perceptions of bribe effectiveness are stronger, investors see a beneficial environment for their new venture (Traikova, Mollers and Buchenrieder, 2017). As explained by the author, those findings were an outcome of a normative belief that conducting business is naturally associated with abiding to some sort of petty corruption, due to the weak rule of law and the lack of trust with local and central governments (Traikova, Mollers and Buchenrieder, 2017).
Dwelling on this evidence, my paper recognizes the previous findings about the inherent role corruption plays in influencing the interactions between political bodies and the MNEs. Thus, I focus on building a framework of how institutional transparency constitutes a valuable signal for FDI allocation within a high-corruption context. This establishes an important contribution to both the dynamic of the Corruption-FDI nexus in Bulgaria, as well as the overall effect domestic bureaucracies have on foreign investors.
Theoretical Framework
Institutions and FDI
Formal institutions are defined as the “rules of the game” which shape human interactions within the society (North, 1990); therefore, modern socio-economic systems rely on those rules as they reduce economic uncertainty and ensure compliance with the legal system. The public sector institutions represented by the established government bodies are the primary mechanisms that ensure a transparent and equitable investment environment (Seyoum and Manyak, 2009). Nevertheless, as identified through the Corruption-FDI nexus, government officials that are prone to corruption have a significant effect on MNEs allocation activities. The helping hand hypothesis established through the nexus argues that in some settings, the opportunity to pay bribes is seen as a mechanism that speeds up bureaucratic services (issuance of permits) and is an accounted cost that is considered necessary for efficiency (Cazurra, 2008). As discussed in Cazurra (2008), transitioning economies represent the cases where local institutions are underdeveloped, and foreign investors operate under a known cost from expropriation that could stimulate them to invest in environments where alleviating the bureaucratic burden is relatively easy. I use this intuition on the subnational FDI allocation incentive in the transitioning context of Bulgaria and argue that in regions where the perception of corruption is higher, investors would allocate more capital as they prefer the opportunity to speed up the business process through bribery.
Corruption, defined as the “abuse of entrusted power for private gain” (TI, 2023) has been an issue receiving relatively strong supervision on a national level, while the lack of generalizable subnational data in the emerging economies composes a theoretical and empirical problem regarding how to address its influence on investors. One effective mechanism to address government abuse of power is using a transparency-based approach. As argued by Sumanjeet (2015, p. 194), the lack of transparency to the public decreases bureaucratic accountability, creates incentives to use political connections for private gains, and ultimately fosters the facilitation of corruption patterns. Nevertheless, corruption and transparency are not used interchangeably in this paper, but the latter is contextualised as a mechanism to account for the former. To illustrate this, the following section offers a strategic interaction between a foreign investor and a government body to elaborate on how MNEs perceive transparency as a credible signal for corruption and post hoc allocate their capital.
The Case Study: Bulgarian Districts
To explain the interaction between public officials and MNEs on a subnational level, I use Bulgaria as a case study. The country represents a highly corrupt environment, where transparency in the public sector could be assessed as a valuable mechanism hampering down the high prevalence of corruption. Furthermore, as a post-Soviet member, the weak institutional characteristics of the state and their influence on FDI could be generalised to the broader framework of the post-communist transitioning economies, to which foreign capital is a crucial instrument for growth (Kostadinova and Neshkova, 2012).
Bulgaria is divided into 28 districts (“oblasti”) which are appointed a “district governor” directly by the central government. The governor constitutes the head of the district's administration, and their combined role is responsible for executing government policies, coordinating local governments, providing services to the public and businesses, etc.3 The district administration is a powerful executive body which is directly responsible for enhancing investments through the Act for the Stimulation of Investments, while its power extends heavily on controlling the legal institutions which affect business development. As already mentioned, corruption within the subnational bodies is difficult to measure; however, the level of public transparency is a possible identification for corruption. One of the existing and empirically measurable proxies for transparency in the context is an administration compliance with the Act on Access to Public Information (AAPI), which provides Bulgarian citizens, foreign individuals, and businesses with access to important public information (GRECO, 2022). The AAPI relates to what has been recognized in the literature as a Freedom to Information law (FOI), which is a legislative framework that has been well established internationally (Costa, 2013). Therefore, the empirical inferences made using the provided framework reflect some external validity to other geographical settings.
Figure 1 explains the causal mechanism describing FDI allocation according to the assumption that transparency indicates proneness to corruption, incentivising MNEs to invest according to the helping hand theory. Region A and B are theoretical locations (in Bulgaria those refer to districts), in which FDI is allocated, while both are assumed to have an underlying (high or low) level of administrative corruption. The two dotted lines represent the level of transparency recognizable to investors by the established FOI, with T1 (High) displaying an administration, which is highly efficient in providing public information and T2 (Low) is a poorly performing one.
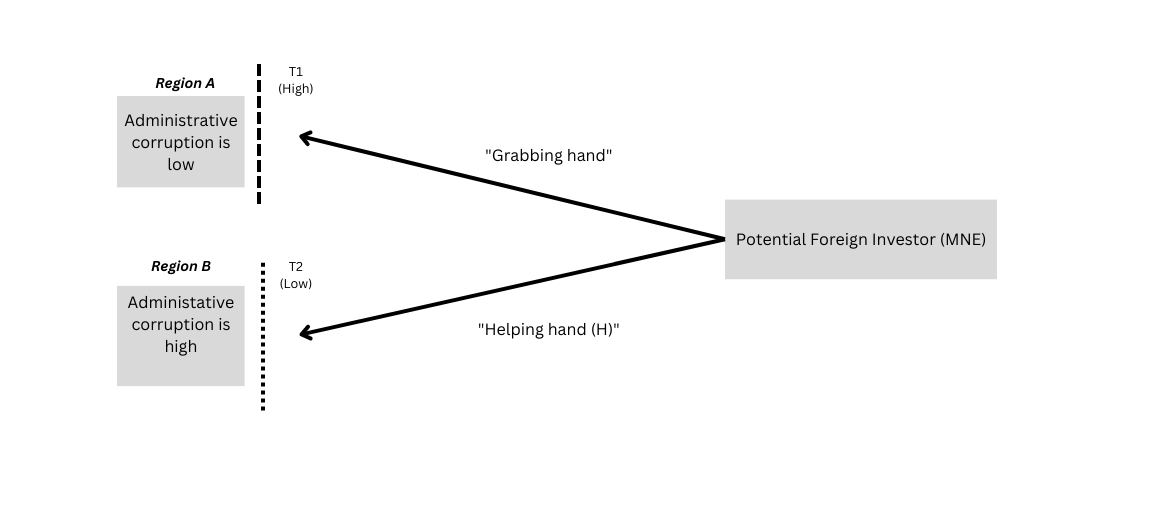
Figure 1. Theoretical mechanism.
Intuitively, a region with T1 is expected to have lower corruption because it is more open for access to valuable information, while the opposite T2 should contain higher levels. On the right-hand side appears the potential foreign investor, who is a rational actor that allocates resources in locations with comparative advantage (Dunning, 2005). Their decision is influenced by one of the two competing assumptions explained in the previous section. In particular, a region where transparency is high and corruption potentially low FDI increases (the grabbing hand) because investors try to avoid additional costs mainly concerned with bribe-paying (OECD, 2013). Consequently, an investor is directed towards T1 (High). With the opposite intuition, an investor could assume that by paying bribes the speed of doing business increases as the burden of bureaucracy is alleviated; therefore, it is more beneficial to invest in Region B with T2, where lower transparency would nourish high corruption. I argue that the latter scenario is more likely in the context of Bulgaria as an emerging economy due to the following reasons. First, there is an established norm that bribes are the cost of doing business (Traikova, Mollers and Buchenrieder, 2017). Second, emerging economies in general are more vulnerable to the helping hand as their bureaucracies are underdeveloped and burdensome (Goswami, 2023). And third, exploitation of public power in the country has been increasingly normalized among the public (Stoyanov, Stefanov and Velcheva, 2014), thus businesses face lower reputational costs if they are perceived to give low-level bribes to escape bureaucratic paperwork. Based on those assumptions, I suggest the following hypothesis to be tested in the empirical model:
(H): Higher levels of transparency decrease the inward flows of FDI.
Method
The data used in this study comprises a panel of all 28 districts in Bulgaria with a temporal coverage of ten years between 2012-2021. The full data set is balanced and consists of 280 observations (28 districts across ten years) and the Appendix (Section II: b) shows the full list of observations used for the analysis. The choice of Bulgaria as a case study was based on its long-standing status of the poorest state in the European Union, to which FDI presents a key mechanism for economic and social development. Furthermore, widespread corruption in the public sector (Stoyanov, Stefanov and Velcheva, 2014) emphasizes the importance of transparency as a mechanism signaling the bureaucratic practices to the MNEs, which is reflected in my main independent variable. The choice of spatial coverage (districts) was based on data availability with regards to FDI. Ideally, this research would have used municipal level data covering the 265 Bulgarian municipalities across time, however, such data on FDI and other important controls required paid access.4 The decision about the specific temporal coverage was based on the data availability of my main explanatory variable: administrative transparency. The Access to Information Program (AIP, 2021) organization has been collecting a methodologically consistent transparency variable only since 2012, which has dictated the collection of the other variables in order to construct a balanced panel set. Table 1. shows the descriptive statistics of the data while the Appendix (Section II: c) contains the correlation matrix of all variables.
Table 1: Descriptive statistics.
| Variable | N | Mean | Median | SD |
|---|---|---|---|---|
| FDI (per capita) | 278 | 1933.09 | 1199.99 | 2121.45 |
| TRANSPARENCY | 279 | 58.68 | 59 | 14.19 |
| ln (GDP) | 280 | 20.73 | 20.51 | 0.88 |
| CRIME | 280 | 52.01 | 54.49 | 12.29 |
| ROADS | 270 | 4.49 | 4.32 | 1.27 |
| EDUCATION | 280 | 22.00 | 20.95 | 7.03 |
| LABOUR | 280 | 68.69 | 69 | 4.90 |
| HOSPITALS | 280 | 11.54 | 8 | 12.34 |
| AGGLOMERATION (a) | 280 | 1.15 | 1.2 | 0.19 |
| AGGLOMERATION (b) | 280 | 0.18 | 0.2 | 0.07 |
To estimate the models in this paper, I used a Fixed Effects (FE) linear regression after the results of a Hausman test suggest that Random Effects could not be chosen over FE (χ2 = 5.82, p-value = 0.56). The sample size of the data restricted the models to Year-FE, which account for time-related shocks and produce good model fits. For comparison reasons, a single District-FE with the main variables was estimated, which produced limited results due to the low number of observations. The relatively larger scale of the dependent variable compared to the explanatory ones raised concerns for heteroscedasticity. The Breusch-Pagan test for heteroscedasticity confirmed the issue, therefore all results were estimated with robust standard errors. The following equations outlines the general model used to test the hypothesis:
FDIit = β0 + β1 TRANSPARENCYit + βΧit + εit
Χ = ROADS + lnGDP + HOSPITALS + CRIME + EDUCATION + LABOUR + AGGLOM (a) + AGGLOM (b) + SOFIA
Where FDI are inflows per capita in district i for year t, TRANSPARENCY is the level of administrations transparency, Χ represents the vector of the control variables and ε is the error term.
Research Design
FDI inflows
The dependent variable in this paper is the total inflow of FDI (in euros) in the non-financial enterprises5, recorded at a district level within the territory of Bulgaria. Data has been collected from the National Statistical Institute of Bulgaria (NSI, 2021) and Infostat (2021) which constitute the sole data sources offering a reliable FDI measure, disaggregated on a subnational level. The final version of the variable is expressed in per capita terms, which has been calculated separately with population data collected once again from NSI (see Appendix, Section I for the distribution of the variable). The FDI inflows indicator is measured for enterprises, in which the share of equity owned by foreign investors is between 10 to 100% and includes transactions in equity capital, intercompany debt, net operating, and distributed profits (NSI, 2021)6. Those characteristics align with the internationally accepted methods for FDI aggregation (OECD, 2023) and have been incorporated in previous studies on the topic (Cazurra, 2008; Habib and Zurawicki, 2001). The choice of the per capita FDI ratio as the outcome variable is influenced from the existing evidence of its empirical importance in previous subnational studies (Dũng, BíchThủy and NgọcThắng, 2018), its substantive value for economic development, and the econometric benefits during the results interpretation. Although robust for the purposes of the analysis, some of the limitations concerning the NSI measure could be assessed alongside other studies which have implemented more targeted and diversified FDI parameters. For example, Garriga (2019) uses new FDI, which contains only the initial investments to an enterprise with the presumption that it is more responsive in capturing MNEs locational incentives. Furthermore, Samford and Gómez (2014) used a disaggregated by sector FDI data (natural resource extraction, manufacturing, etc., pp. 469-471), which can produce more targeted inferences on MNEs investment incentives in the country. While my FDI measure is rather constrained in providing such information, it represents the single available empirical tool for explaining investment patterns across districts, whereas a more detailed measure grouped by economic activities is accessible only on the national level.
On a regional level, being the primary focus in this essay, FDI appears to be highly localized. Focusing on the average FDI per capita registered between 2012-2021 (Figure 2), which captures the importance of foreign capital inflows for the domestic economy, Sofia capital attracts 9.3 thousand euros per person, followed by Sofia (province) with 6.5 thousand, Burgas (4.7 thousand) and Varna (3.5 thousand). The high per capita values recorded in the capital could be explained by the extensive array of competitive benefits attracting FDI, mainly a stable economic and financial environment for investments in the information and technology, tourism, trade, and scientific research sectors (IME, 2021). Varna and Burgas on the other hand represent the coastal districts offering an advantageous exposure to the country’s ports and seasonal tourism, while Sofia (province) benefits significantly through the economic slipovers from the capital.
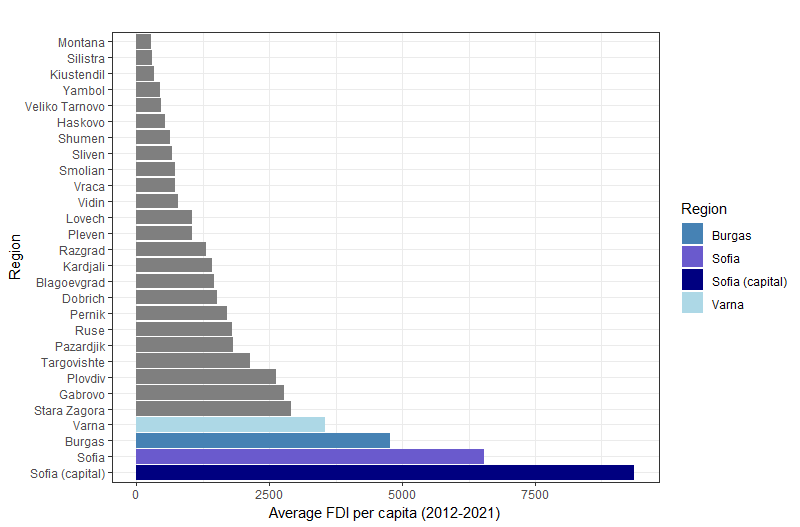
Figure 2. Average FDI per Capita (Euros) in the Period 2012-2021 (From Own Calculations). Sources: NSI, Infostat.
Independent Variables (IV)
The main independent variable in this paper is institutional transparency measured by the district’s administration responsiveness to the AAPI. The Act was created in the 2000s with the aim to guarantee transparency and legal oversight of the executive authorities (GRECO, 2022). According to the legal framework of AAPI, the institutional bodies obliged under this law are required to provide public information within 14 days after a request (GRECO, 2022, p. 23). While not established to control corruption directly, AAPI is a formal institution which constitutes the base mechanism that mandates transparency to the public and the business (Costa, 2013; Žuffová, 2020). Figure 3 shows the distribution of the variable.
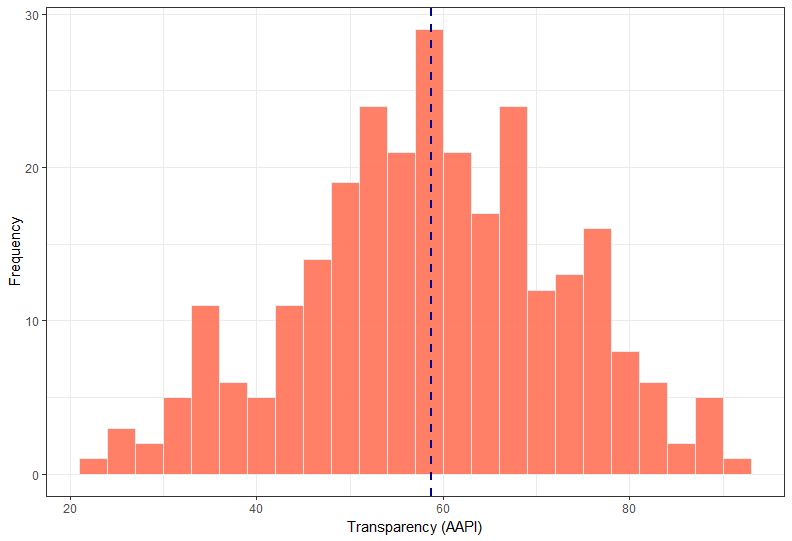
Figure 3. Distribution of the Transparency Variable. Note: Dotted Line Represents the Mean.
Data on administrative transparency is provided by the Access to Information Program (AIP) - an independent non-governmental organization, which conducts annual audits on various government bodies with the aim to monitor compliance with the AAPI (AIP, 2021). The audit after which the transparency scores were estimated is based on a survey questionnaire examining the availability of important information such as financial reports, public procurement, and responsiveness to e-requests. The auditing process was based on administrations covering several access-to-information criteria. The final version of the variable is given in percentages, with a 100% performance constituting an on-time provided information for all categories (full transparency). The full list of categories and questions through which the percentage scores have been calculated is visible in the Appendix (Section II: d).
One possible concern when using this variable is the possibility of capturing quality of governance instead of corruption, however, it is nonetheless a helpful proxy. As identified by Hart (2019) proxy indicators such as administrative ratings are useful in the context of corruption if they are shown to be directly linked to it. On this note, previous literature on Freedom of Information Laws have shown that those legislations are significantly associated with altering the levels of domestic corruption as they increase accountability and elucidate political actions (Costa, 2013; Žuffová, 2020).
Controls
Economic Development, Human Capital, and Infrastructure
Starting from the common indicators, previous subnational studies have identified economic development as significantly related to FDI inflows (Avioutskii and Tensaout, 2016; Garriga, 2021). In the empirical model I use the natural log of GDP per capita, which I expect to have a positive effect on FDI, as investors prefer local markets with better economic opportunities. Next, I use a measure for labour availability, namely the sum of employed and unemployed people as a percentage of the total population. Here, the collection method of the data considers unemployed individuals as those who also actively pursue employment in the future7. With regards to human capital and infrastructure as key dimensions attracting foreign capital, I consider the relative ratio of people (aged between 25-64 years) with a higher education degree, which is a proxy for the availability of high-skilled workforce. Similar variables in other studies have been recognized to attract investments seeking growth in productivity (Chidlow, Salciuviene and Young, 2009). An alternative measure for human capital which is used for comparison between the models is physical health, proxied by the number of hospitals registered in a region by the end of the calendar year. On the role of infrastructure, I operationalize the total length of third-class roads within a region. A potential limitation of this measure is that a more relevant determinant to FDI would be the availability of first- and second-class roads, as they constitute the main routes during transportation. Nevertheless, the chosen indicator presents the most time-consistent variable in availability.
Agglomeration, Geography, and Crime
The agglomeration effect resembles the economic process, in which investors allocate resources to locations with already established investment activity and firms’ presence. This sends credible signals for an FDI-conducive economic environment (Campos and Kinoshita, 2003). Previous literature on the transitioning economies (Resmini, 2003) has identified agglomeration as an important determinant of FDI. In the empirical model, I account for agglomeration economies through the location advantages stimulated by middle-sized and large firms (Bronzini, 2004). I use two separate variables, mainly the ratio of enterprises with 50-249 employees from the total number of non-financial enterprises and the ratio of those with over 250 employees. Operationalizing two separate measures is used to compare which type of enterprise is more influential in attracting FDI across districts.
Additionally, I consider the influence of the capital city Sofia as a geographical unit, which represents the district and city with both the highest total inflows and per capita FDI. Finally, previous studies (Bitzenis, 2003; Glaister and Atanasova, 2001) on Bulgarian FDI indicate that criminal activity represents one of the central issues discouraging FDI on a national level, while the empirical effect on a subnational level is yet to be determined. To address this issue, I use the rate of discovered crimes against the person and property from the total crimes registered. In summary, the Appendix (Section II: a) shows the names of all variables used in the empirical model, their substantive description, unit of measurement and data source.
Results
Table 2 provides a series of panel regressions with Models 1-6 including Year-FE, while Model 7 is the District-FE. Model 1 presents the bivariate relationship without the controls where Transparency shows a negative effect on FDI. The next four columns (2-5) progressively include the relevant IVs with all districts involved in the estimations to test for the robustness of the Transparency effect. Overall, a unit increase in administrative transparency decreases inward FDI, which is in line with the suggested helping hand hypothesis. The effects remain statistically significant (Models 2-4 & 6); Model 5 produces non-significant results due to the omission of GDP; and Model 7 (District-FE) is generally restricted when predicting the effects in all variables (R2= 0.11). The magnitude of the Transparency effect decreases when accounting for Agglomeration and Sofia; nevertheless, its values remain significant. As expected, GDP is the most relevant predictor; keeping a significance at the 1% confidence level across all models and its positive effect on FDI identifies the importance economic development plays for MNEs. Model 5 excludes GDP to identify the effect of access to healthcare (Hospitals) because the two variables are highly correlated, which could lead to inaccurate results. More hospitals increase the FDI levels, which is in line with the findings in previous literature on human capital (Salike, 2016). However, by not including GDP, the effects of Hospitals and the other controls are overestimated (crime and labour become highly significant), which explains the loss of significance in Transparency.
Models 3 and 4 identify that a higher presence of large-scale enterprises (Agglom b) is the only significant predictor to FDI with regards to agglomeration. This suggests that large firms are more important towards FDI attraction, as the advantages they stimulate in higher technological and “know-how” spill overs, and access to a larger market share during acquisitions (Bronzini, 2004, p. 10), are more valuable to the MNEs looking to invest in Bulgaria. For this reason, I use only the Agglomeration b variable as a control for Models 5-7. The agglomeration effect shows the highest magnitude from the continuous variables, while its inclusion does not affect the significant values of Transparency. Model 6 accounts for the road length as an infrastructural cofounder, which is significant and positively correlated with FDI, holding else constant. In this case, the estimation of the entire model excludes Sofia (capital) as an observation because data on road length in the city was not recorded. This in return raises two important conclusions. First, without Sofia, Transparency is significant only on the 10% level, which potentially suggests that the observed highly significant results in the other estimations are dependent on the large allocation of FDI in the capital. Second, by excluding Sofia from the model, the predictive power drops drastically (R2=0.45), which acknowledges a possible lack of variance in FDI allocation in the other observations. Models 3-5 show highly significant evidence (p<0.001) that Sofia is a driving force for FDI, with the district receiving on average five thousand more euros than the other districts.
With regards to the labour force variables, Education and Labour are significant predictors of FDI, while their effects are dependent on the inclusion of Agglomeration and Sofia. Furthermore, the two variables do not affect Transparency as an explanatory measure. In Models 3-6, a percentage increase in the population with higher education decreases FDI per capita, which although counterintuitive is in line with Dunning’s (2005) description of efficiency-seeking investments. This means that on a subnational level, MNEs prefer districts where a comparative advantage of cheaper labour is present. In the context of this analysis, higher education provides workers with advanced skill sets demanding higher pay; therefore, MNEs prefer to invest in locations where an efficiency from lower labour cost could be extracted. Labour availability on the other hand is with the expected positive sign, while the effect remains significant across models. Finally, an increase in the levels of discovered crime does not influence FDI, which contradicts some of the previous literature findings (Bitzenis, 2003). Furthermore, as already explained, the significant coefficient in Model 5 is an outcome from the omittance of the GDP effect.
Table 2. Regression output.
| FDI per capita | |||||||
| (1) | (2) | (3) | (4) | (5) | (6) | (7) | |
| Transparency | -67.00*** | -39.93*** | -21.80*** | -16.78** | -10.79 | -14.36* | 0.74 |
| (16.66) | (8.74) | (7.45) | (7.75) | (8.30) | (7.69) | (2.94) | |
| Roads | 113.26* | ||||||
| (64.23) | |||||||
| GDP log | 1,972.35*** | 1,641.71*** | 1,597.60*** | 1,501.47*** | 1,252.28*** | ||
| (195.56) | (164.95) | (167.99) | (146.95) | (342.83) | |||
| Hospitals | 109.07*** | ||||||
| (17.50) | |||||||
| Crime | 11.18 | 0.70 | -7.82 | -31.02*** | -7.76 | 2.57 | |
| (8.44) | (7.28) | (7.47) | (7.78) | (7.64) | (3.99) | ||
| Education | -19.05 | -104.13*** | -107.03*** | -91.42** | -105.02*** | 13.60 | |
| (29.83) | (34.55) | (33.15) | (36.47) | (31.62) | (20.26) | ||
| Labour | 20.50 | 42.94* | 37.50* | 49.41** | 35.00* | 12.91 | |
| (22.47) | (23.86) | (21.05) | (23.88) | (19.96) | (13.55) | ||
| Agglom (a) | 146.43 | ||||||
| (408.98) | |||||||
| Agglom (b) | 2,956.80*** | 3,995.56*** | 3,484.14*** | -30.37 | |||
| (976.05) | (974.33) | (960.30) | (663.25) | ||||
| Sofia | 5,051.00*** | 5,128.22*** | 3,069.47*** | ||||
| (644.22) | (602.87) | (933.85) | |||||
| Observations | 277 | 277 | 277 | 277 | 277 | 267 | 277 |
| Adjusted R2 | 0.09 | 0.65 | 0.71 | 0.71 | 0.65 | 0.45 | 0.11 |
| Note: | *p<0.1; **p<0.05; ***p<0.01 | ||||||
| Regression coefficients with standard errors | |||||||
Discussion
The empirical findings from this research could be evaluated based on Models 4 and 6 in the analysis, which include the most relevant confounding factors and exclude the capital as a possible outlier. A 1% increase in Transparency decreases FDI inflows by 16.8 euros, while the effect is statistically significant on the preferred 5% confidence level. Nevertheless, the magnitude of this effect is small compared to the other significant variables, suggesting that Transparency is not a dominating influence on MNEs operating in Bulgaria. In addition, the role of the effect is further undermined after excluding Sofia (capital) as a potential outlier dropping its value to -14.3 euros (with p<0.1). Therefore, at best I reject the null at the 10% confidence level. While limited and subject to further investigation in upcoming research, the evidence that higher FDI is allocated to less transparent districts uncovers several potential inferences for the Bulgarian institutional system. District bureaucracies continue to be heavily burdensome, which incentivizes alternative measures for speeding up business activity. Investors in return recognize that this burden could be circumvented using illicit methods; therefore, they choose non-transparent environments where such interactions flourish.
Reaching beyond those results, it is critical to link the influence of transparency towards its practical application in Bulgaria. The association between lower transparency and higher FDI should not be understood as an incentive to limit the access to information in the future, but rather the contrary. While the results suggest that investors value the opportunities to benefit from the corrupt system, that does not imply that more pervasive corruption in the future would stimulate higher investments. With low transparency breeding higher bureaucratic expropriation, the increasing negative externalities of corruption (unequal playing field, higher risks with returns on investments [OECD, 2013]) would outweigh the benefits assumed under the helping hand hypothesis, which would ultimately result in plummeting FDI attraction to the country. Furthermore, as reflected by Gossel (2018), investors choose the helping hand only when democratisation and institutional quality remain weak. With digitalization of the institutions through e-governance (Warf, 2017) and better compliance to the FOI laws, an increased accountability and regulation could benefit the democratization process in Bulgaria. This would eventually discourage MNEs to allocate resources in less transparent districts and recognize non-corrupt administrations as more attractive.
Conclusion
Using a panel data set on the 28 Bulgarian districts between 2012-2021, this paper has provided empirical evidence that districts with more transparent political institutions attract less FDI as investors value the opportunity to escape bureaucratic burdens in corruption-nourishing locations. The study offers a new approach of testing the “helping hand” hypothesis under the Corruption-FDI nexus. I offer a theory in which the perception about corruption is based on the access to public information the administrations provide. Later, the regression analysis shows statistically significant evidence that transparency, while minor, is a mechanism negatively influencing FDI.
Apart from the Corruption-FDI literature, this research benefits several other important areas. Firstly, this study provides further empirical evidence about the factors stimulating subnational FDI with economic development, agglomeration, the capital city, and the levels of education showing high association with inward FDI. Secondly, I provide evidence that laws on freedom of information have an influence on FDI, which bridges the gap between FOI (Costa, 2013; Žuffová, 2020) and International Business (Seyoum, B. and Manyak, 2009) literature. Prospective studies should identify whether such a relationship is generalizable on a cross-country basis. And finally, I contribute to the scarce body of work on Bulgarian political institutions and their relation to FDI. One of the limitations of my analysis was that the IV measuring institutional quality via transparency is potentially not entirely linked to corruption but is also an outcome of poor governance and administrative coordination. Therefore, upcoming analyses should benefit from projects such as the Local Integrity System (LIS)8, which has been collecting anti-corruption capacity data for various Bulgarian municipalities that could offer an improved operationalization of the corruption variable. Furthermore, an important improvement could be using municipal-level data on FDI, which currently requires paid access. This would allow for the inclusion of important political measures such as partisanship and electoral races, which could provide new insights of the political dynamics that could better explain MNEs decision alongside corruption.
References
Access To Information Program (AIP) (2021) Active Transparency Rating, Surveys: 2012-2021. Available at: https://www.aip-bg.org/en/surveys/ (Accessed: 11 April 2023).
Avioutskii, V. and Tensaout, M. (2016) ‘Does politics matter? Partisan FDI in Central and Eastern Europe’, Multinational Business Review, 24(4), pp. 375–398. Available at: https://doi.org/10.1108/mbr-07-2015-0028.
Barassi, M.R. and Zhou, Y. (2012) ‘The effect of corruption on FDI: A parametric and non-parametric analysis’, European Journal of Political Economy, 28(3), pp. 302–312. Available at: https://doi.org/10.1016/j.ejpoleco.2012.01.001.
Bitzenis, A. (2003) ‘Universal Model of theories determining FDI. Is there any dominant theory? Are the FDI inflows in the CEE countries and especially in Bulgaria a myth?’, European Business Review, 15(2), pp. 94–104. Available at: https://doi.org/10.1108/09555340310464722.
Bronzini R. (2004) Foreign direct investment and agglomeration: evidence from Italy, ERSA conference papers, European Regional Science Association, pp. 4–51, Available at: http://www.bancaditalia.it/pubblicazioni/temi-discussione/2004/2004-0526/tema_526.pdf (Accessed: 16 April 2024)
Budsaratragoon, P. and Jitmaneeroj, B. (2019) ‘A critique on the Corruption Perceptions Index: An interdisciplinary approach’, Socio-Economic Planning Sciences, 70 (article 100768). Available at: https://doi.org/10.1016/j.seps.2019.100768.
Bulgarian National Bank (BNB) (2022) Foreign Direct Investments in Bulgaria: Inflow of foreign direct investments by type of investment- annual data (millions of euros). Available at: https://www.bnb.bg/Statistics/StExternalSector/StDirectInvestments/StDIBulgaria/index.htm?FILTERSANDVALUES=%27FREQ=A;ACCOUNTING_ENTRY=NI;FLOW_STOCK_ENTRY=T;COUNTERPART_AREA=W1;UNIT_MEASURE=EUR;ACTIVITY_N=FDI_T%27&pageId=538&series=640,4886,637,634,413&KEYFAMILY=FDI_BPM6&TRANSFORMATION=SDMX_TABLE# (Accessed: 9 April 2023).
Camarero, M., Montolio, L. and Tamarit, C. (2019) ‘Determinants of FDI for Spanish regions: evidence using stock data’, Empirical Economics, 59(6), pp. 2779–2820. Available at: https://doi.org/10.1007/s00181-019-01748-8.
Campos, N.F. and Kinoshita, Y. (2003) ‘Why Does FDI Go Where it Goes? New Evidence from the Transition Economies’, IFM Working Papers, 2003(228), pp. 1–32. Available at: https://doi.org/10.2139/ssrn.880925.
Cazurra, A.C. (2008) ‘Better the devil you don’t know: Types of corruption and FDI in transition economies’, Journal of International Management, 14(1), pp. 12–27. Available at: https://doi.org/10.1016/j.intman.2007.02.003.
Chidlow, A., Salciuviene, L. and Young, S. (2009) ‘Regional determinants of inward FDI distribution in Poland’, International Business Review, 18(2), pp. 119–133. Available at: https://doi.org/10.1016/j.ibusrev.2009.02.004.
Costa, S. (2013) ‘Do Freedom of Information Laws Decrease Corruption?’, The Journal of Law, Economics, and Organization, 29(6), pp. 1317–1343. Available at: https://doi.org/10.1093/jleo/ews016
Dũng, N.V., BíchThủy, Đ.T. and NgọcThắng, N. (2018) ‘Economic and non-economic determinants of FDI inflows in Vietnam: a sub-national analysisPost-Communist Economies’, Post-Communist Economies, 30(5), pp. 693–712. Available at: https://doi.org/10.1080/14631377.2018.1458458.
Dunning, J. (2005) ‘Institutional reform, foreign direct investment, and European transition economies’, in R. Grosse (ed) International Business and Government Relations in the 21st Century. Cambridge: Cambridge University Press, pp. 49–78. Available at: https://doi.org/10.1017/CBO9780511488597
Egger, P. and Winner, H. (2005) ‘Evidence on corruption as an incentive for foreign direct investment’, European Journal of Political Economy, 21(4), pp. 932–952. Available at: https://doi.org/10.1016/j.ejpoleco.2005.01.002.
Garriga, A.C. (2021) ‘International Capital and Subnational Politics: Partisanship and Foreign Direct Investment in Mexican States’, Political Research Quarterly, 75(4), pp. 1006–1020. Available at: https://doi.org/10.1177/10659129211030331
Glaister, K.W. and Atanasova, C.V. (2001) ‘FDI in Bulgaria: Evidence from Pioneering Firms’, Journal of East-West Business, 6(2), pp. 33–58. Available at: https://doi.org/10.1300/J097v06n02_03.
Goodspeed, T., Martinez-Vazquez, J. and Zhang, L. (2006) ‘Are Other Government Policies More Important than Taxation in Attracting FDI?’, Andrew Young School of Policy Studies Research Paper No. 6-28. Available at: https://doi.org/10.2139/ssrn.895150.
Gossel, S.J. (2018) ‘FDI, democracy and corruption in Sub-Saharan Africa’, Journal of Policy Modeling, 40(4), pp. 647–662. Available at: https://doi.org/10.1016/j.jpolmod.2018.04.001.
Goswami, V. (2023) ‘Do institutional determinants matter for FDI inflows location choice? Evidence from sub-national panel data in India’, International Journal of Emerging Markets. Available at: https://doi.org/10.1108/ijoem-11-2021-1725.
GRECO (2022) Пети кръг на оценка: Предотвратяване на корупцията и насърчаване на почтеността в централното управление (висшите държавни длъжности) и правоохранителните органи [Fifth round of evaluation: Corruption Prevention and integrity promotion in the central and law enforcement authorities]. Available at: https://rm.coe.int/-/1680a9cab6 (Accessed: 16 April 2024).
Habib, M. and Zurawicki, L. (2001) ‘Country-level investments and the effect of corruption - some empirical evidence’, International Business Review, 10(6), pp. 687–700. Available at: https://doi.org/10.1016/S0969-5931(01)00038-5.
Hart, E. (2019) Guide to using corruption measurements and analysis tools for development programming, Chr. Michelsen Institute, U4 Guide 2019:1, Available at: https://www.u4.no/publications/guide-to-using-corruption-measurements-and-analysis-tools-for-development-programming. (Accessed: 16 April 2024)
Integrated Informational System of the State’s Administration (IISSA) (2024) Administrative Structures. Available at: https://iisda.government.bg/ (Accessed 16 April 2024).
Infostat (2021) MAIN INDICATORS CHARACTERIZED THE DEMOGRAPHIC, SOCIAL AND ECONOMIC DEVELOPMENT OF THE DISTRICTS. Available at: https://infostat.nsi.bg/infostat/pages/reports/query.jsf?x_2=754 (Accessed: 13 April 2023).
Institute for Market Economy (IME) (2021) Economic and Investment Profile of Sofia Municipality 2021. Available at: https://ime.bg/var/images/InvestSofia2021.pdf (Accessed: 10 April 2023).
Institute for Market Economy (IMEa) (2021) Regional profiles: Security and Justice, Clearance rate for crimes against the person and property, registered throughout the year. Available at: https://www.regionalprofiles.bg/en/methodology/security-and-justice/ (Accessed: 5 May 2023).
Institute for Market Economy (IMEb) (2023) The 265 Stories of the Economy. Available at: https://265obshtini.bg/map/313 (Accessed 16 April 2024).
Jeong, D., Shenoy, A. and Zimmermann, L.V. (2023) ‘De Jure versus De Facto transparency: Corruption in local public office in India’, Journal of Public Economics, 221 (article 104855). Available at: https://doi.org/10.1016/j.jpubeco.2023.104855.
Kostadinova, T. and Neshkova, M.I. (2012) The Effectiveness of Administrative Reform in New Democracies. Public Administration Review, 72(3), pp. 324–333. Available at: https://doi.org/10.1111/j.1540-6210.2011.02483.x.
National Statistical Institute of Bulgaria (NSI) (2021) Regional Statistics. Available at: https://www.nsi.bg/en/content/797/regional-statistics (Accessed: 9 April 2023).
National Statistical Institute (NSI a) (2022) Labor force and activity rates - national level; statistical regions; districts – Metadata and Methodology. Available at: https://www.nsi.bg/en/content/4007/labour-force-and-activity-rates-national-level-statistical-regions-districts (Accessed: 16 April 2024).
North, D. (1990) Institutions, Institutional Change and Economic Performance (Political Economy of Institutions and Decisions). Cambridge: Cambridge University Press. Available at: https://doi.org/10.1017/CBO9780511808678.
OECD (2023) FDI flows (indicator). Available at: https://doi.org/10.1787/99f6e393-en.
OECD (2022) ‘Overview and key principles’, in FDI Qualities Policy Toolkit, OECD Publishing, Paris. Available at: https://doi.org/10.1787/0fff9c9f-en.
OECD (2013) ‘What are bribery and corruption?’, in Bribery and Corruption Awareness Handbook for Tax Examiners and Tax Auditors. OECD Publishing, Paris. Available at: https://doi.org/10.1787/9789264205376-3-en.
Resmini, L. (2003) ‘The Determinants of Foreign Direct Investment in the CEECs: New evidence from sectoral patterns’, Economics of Transition and Institutional Change, 8(3), pp. 665–689. Available at: https://doi.org/10.1111/1468-0351.00060.
Salike, N. (2016) ‘Role of human capital on regional distribution of FDI in China: New evidences’, China Economic Review, 37, 2016, pp. 66–84. Available at: https://doi.org/10.1016/j.chieco.2015.11.013.
Samford, S. and Gómez, P.O. (2012) ‘Subnational politics and foreign direct investment in Mexico’, Review of International Political Economy, 21(2), pp. 467–496. Available at: https://doi.org/10.1080/09692290.2012.733316.
Seyoum, B. and Manyak, T.G. (2009) ‘The impact of public and private sector transparency on foreign direct investment in developing countries’, Critical Perspectives on International Business, 5(3), pp. 187–206. Available at: https://doi.org/10.1108/17422040910974686.
Stoyanov, A., Stefanov, R. and Velcheva, B. (2014) ‘Bulgarian Anti-Corruption Reforms: A Lost Decade?’, European Research Centre for Anti-Corruption and State-Building, Working Paper No. 42. Available at: https://www.againstcorruption.eu/publications/bulgarian-anti-corruption-reforms-lost-decade/ Accessed: 16 April 2024).
Sumanjeet (2015) ‘Institutions, Transparency, and Economic Growth’, Emerging Economic Studies, 1(2), pp. 188–210. Available at: https://doi.org/10.1177/2394901515599272.
Teixeira, A.A.C. and Guimarães, L. (2015) ‘Corruption and FDI: Does the Use of Distinct Proxies for Corruption Matter?’, Journal of African Business, 16(1-2), pp.159–179. Available at: https://doi.org/10.1080/15228916.2015.1027881.
Traikova, D., Mollers, J. and Buchenrieder, G, (2017) ‘CORRUPTION PERCEPTIONS AND ENTREPRENEURIAL INTENTIONS IN A TRANSITIONAL CONTEXT–THE CASE OF RURAL BULGARIA’, Journal of Developmental Entrepreneurship, 22(03), p. 1750018. Available at: https://doi.org/10.1142/s1084946717500182.
Transparency International (TI) (2023) What is Corruption?. Available at: https://www.transparency.org/en/what-is-corruption.(Accessed: 16 April 2024)
Transparency International (TIa) (2022) CORRUPTION PERCEPTIONS INDEX. Available at: https://www.transparency.org/en/cpi/2022 (Accessed: 16 April 2024).
Transparency International Bulgaria (TIB) (2022) Local Integrity System. Available at: https://lisi.transparency.bg/en/?_gl=1%2Amn3lfe%2A_ga%2AOTE1NDU4ODI3LjE3MTMyNjI5OTI.%2A_ga_V8HL8MMCST%2AMTcxMzI2Mjk5Mi4xLjAuMTcxMzI2Mjk5Mi4wLjAuMA (Accessed: 16 April 2024).
Warf, B. (2017) ‘Introduction’ in E-Government in Asia: Origins, Politics, Impacts, Geographies. Chandos Publishing, pp. 1–18. Available at: https://doi.org/10.1016/B978-0-08-100873-7.00001-5.
Žuffová, M. (2020) ‘Do FOI laws and open government data deliver as anti-corruption policies? Evidence from a cross-country study’, Government Information Quarterly, 37(3), p. 101480. Available at: https://doi.org/10.1016/j.giq.2020.101480.
Copyright Statement
©Georgi Velinov Dobrev. This article is licensed under a Creative Commons Attribution 4.0 International Licence (CC BY).
Appendix
Section I: Graphs
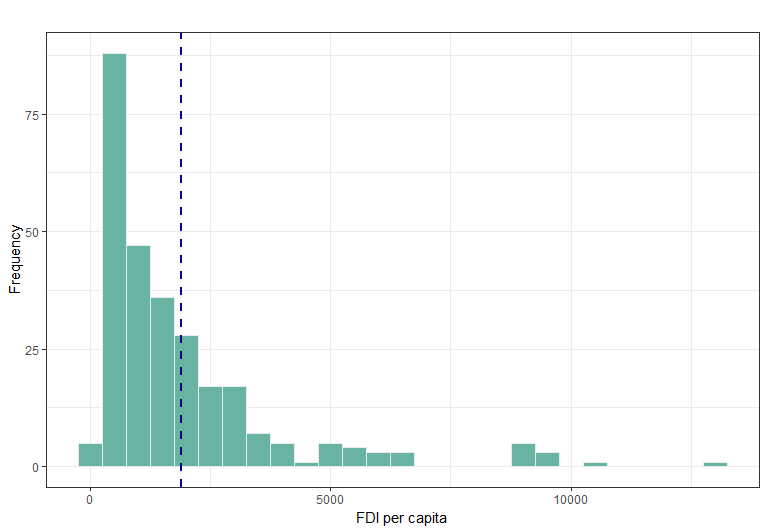
Figure 4. Distribution of FDI per capita (dependent variable).
Section II: Tables
Research Design - Variables
Table 1. Variables definitions and sources.
| Variable | Description | Unit of Measurement | Source |
|---|---|---|---|
| POPULATION | Total number of people in a region. | Number | NSI, Infostat |
| ROADS | The total length of 3rd class roads |
Hundreds of kilometers | NSI, Infostat |
| FDI (per capita) | FDI inflows in the non-financial enterprises divided by the total population in a region. Values are in euros. | Euros | NSI, Infostat |
| TRANSPARENCY | The regional administration transparency according to the AAPI. Higher values indicate more transparency. | % | AIP |
| ln (GDP) | Natural log of host region GDP in euros | Euros (log scale) | NSI9, Infostat |
| CRIME | The the rate of discovered crimes against the person and property from the total crimes registered in a given year. | % | IME (a) |
| EDUCATION | The share of the population aged between 25 and 64 years with higher education. | % | NSI, Infostat |
| LABOUR | The share of active labor from the total population in a region. | % | NSI, Infostat |
| HOSPITALS | The number of hospitals as of 31.12. | Number | NSI, Infostat |
| AGGLOMERATION (a) | Share of non-financial enterprises with 50-249 employees from the total number of non- financial enterprises | % | NSI, Infostat |
| AGGLOMERATION (b) | Share of non-financial enterprises with 250 or more employees from the total number of non- financial enterprises | % | NSI, Infostat |
Table 2: Data - Observations names.
| District names | |||
|---|---|---|---|
| Vidin | Varna | Kiustendil | Silistra |
| Vraca | Dobrich | Pernik | |
| Lovech | Targovishte | Sofia | |
| Montana | Shumen | Sofia (capital) | |
| Pleven | Burgas | Kardjali | |
| Veliko Tarnovo | Sliven | Pazardjik | |
| Gabrovo | Stara Zagora | Plovdiv | |
| Razgrad | Yambol | Smolian | |
| Ruse | Blagoevgrad | Haskovo |
Table 3: Correlation matrix.
| FDI | Transparency | GDP (ln) | Crime | Education | Labour | Hospitals | Roads | Agglomeration (a) | Agglomeration (b) | |
|---|---|---|---|---|---|---|---|---|---|---|
| FDI | 1 | -0.00098 | 0.611112 | -0.19496 | -0.00336 | 0.197 | 0.474259 | 0.363131 | 0.08217835 | -0.054173508 |
| Transparency | -0.00098 | 1 | 0.207196 | 0.357528 | 0.177777 | 0.190744 | 0.070494 | 0.010807 | -0.23751785 | -0.335173087 |
| GDP (ln) | 0.611112 | 0.207196 | 1 | -0.30227 | 0.369899 | 0.270865 | 0.870225 | 0.408517 | -0.07502633 | -0.078235474 |
| Crime | -0.19496 | 0.357528 | -0.30227 | 1 | -0.08998 | 0.035882 | -0.34151 | -0.20625 | 0.20270356 | 0.105159529 |
| Education | -0.00336 | 0.177777 | 0.369899 | -0.08998 | 1 | 0.405951 | 0.294319 | -0.0366 | 0.0286372 | 0.021174065 |
| Labour | 0.197 | 0.190744 | 0.270865 | 0.035882 | 0.405951 | 1 | 0.127463 | 0.143109 | 0.03952217 | -0.295000622 |
| Hospitals | 0.474259 | 0.070494 | 0.870225 | -0.34151 | 0.294319 | 0.127463 | 1 | 0.505464 | -0.05661373 | 0.037302627 |
| Roads | 0.363131 | 0.010807 | 0.408517 | -0.20625 | -0.0366 | 0.143109 | 0.505464 | 1 | -0.20291621 | -0.136612009 |
| Agglomeration (a) | 0.082178 | -0.23752 | -0.07503 | 0.202704 | 0.028637 | 0.039522 | -0.05661 | -0.20292 | 1 | 0.53208934 |
| Agglomeration (b) | -0.05417 | -0.33517 | -0.07824 | 0.10516 | 0.021174 | -0.295 | 0.037303 | -0.13661 | 0.53208934 | 1 |
Table 4: Categories and questions used for the auditing process by API.
| Category A: Institutional information | Category B: Operational Information – acts, strategies and plans, activities, and activity reports |
|---|---|
| Is the description of the powers/functions of the institution published? | Is a list of normative acts published: rules, regulations, instructions, and ordinances? |
| Are the Structural Regulations of the institution published online? | Are the texts of the normative acts regulating the activities of the institution published online? |
| Is a list of the administrative services provided by the institution published online? | Are the texts of draft normative acts published online? |
| Are the internal rules for the provision of administrative services published? | Are the motives behind the draft normative acts published? |
| Is the structure of the administration published online? | Is regulatory impact assessment published? |
| Is there information about civil servants’ competitive examinations? | Is the report from the public consultation on the draft normative acts published? |
| Is there а Contacts Section? | Is a list of the general administrative acts issued by the institution published? |
| What type of information is published? | Are the texts of the general administrative acts issued by the institution published? |
| Is there a description of the registers and datasets maintained by the institution? | Are notifications for opening a procedure for issuing a general administrative act published? |
| Are registers maintained by the institution available on the web site? | Is there a register of the individual administrative acts? |
| Category C: Budget, Financial, Public Procurement and Integrity Information | Are development strategies published on the web site? |
| Is the budget of the institution published on the web site? | Are development programs published on the web site? |
| Is the financial report published on the web site? | Are development plans published on the web site? |
| Is the institution a first-degree budget spending unit? | Are activity reports of the institution published on the web site? |
| Are the monthly reports for the execution of the budget published online? | Category D: Access to Information Section – information about the right to information and how to exercise it |
| Are the quarterly reports for the execution of the budget published online? | Is there an Access to Information Section on the website? |
| Is the institution using program budgeting by the law? | Where is the Access to Information Section located? |
| Is the program budget of the institution published? | Is there information about the department responsible for access to information? |
| Are quarterly expenditure reports on the program budget published? | What type of information is online available? |
| Are bi-annual expenditure reports on the program budget published? | Is there explanatory information on how to exercise one‘s right to information? |
| Is an annual expenditures report on the program budget published? | Where did you find the explanatory information on how to exercise one‘s right to information? |
| Is the institution using program budgeting on its own choice? | Is information about the procedure and the conditions for the re-use of public sector information published? |
| Are the payments made through the Electronic State Budget Payments System (SEBRA)2 available online? | Is information about the charges for the re-use of public sector information published? |
| Is a Citizens ‘Budget published? | Is information about the charges for access to information published? |
| Is there a Buyer Profile Section on the web site? | Are the APIA implementation internal rules published? |
| Are calls for public procurement tenders published on the web site? | Are the Internal Rules updated in line with the AAPI amendments as of December 2015? |
| Is the public procurement tender documentation published on the web site? | Where are they published? |
| Are the protocols of the public procurement assessment commissions published? | Is the annual report on the AAPI implementation published? |
| Are public procurement contracts of the institution published on its web site? | Does it contain data about registered requests? |
| Is a list of the officials who have submitted conflict of interests and assets declarations available online? | Does it contain data about issued refusals? |
| Are the conflict of interests and assets declarations published on the web site? | Does it contain the grounds for the issued refusals? |
| Is the date of the public discussion on the draft municipal budget published? | Is there a description of the procedure for access to the public registers maintained by the respective institution? |
| Is the draft of the municipal budget published? | Is a list of the categories of information classified as official secret published on the website? |
| Is the date of the public discussion on the financial annual report on the execution of the municipal budget published? | Is a list of documents declassified under § 9 of the Protection of Classified Information Act published? |
| Is the financial report on the execution of the municipal budget published? | Is there a list of the categories of information, subject to publication online concerning the sphere of activity of the respective institution? |
| Is there a section for information provided more than three times at a request? | |
| Is the place for inspecting/reading the provided information signified? | |
| Are electronic access to information requests accepted? | |
| Is an electronic signature required to submit an access to information request? | |
| Is there an answer to E-requests? | |
| Response way to e-requests? | |
| Access to Requested Information? |
Note: The questions have been extracted through the Annexes published by API (2021) at: https://data.aip-bg.org/en/surveys/FQWA23/
Transparency International has given Bulgaria a score of 42 (out of 100) on its Corruption Perception Index in 2021, making the lowest performing state in the EU (TI a, 2022).↩︎
The CPI has been estimated annually by the Transparency International organization and measures the perceived levels of public sector corruption (TIa, 2022). The index has often been criticized by scholars for being biased due to the subjective opinion individuals could provide, with evidence suggesting data sources have аn unequal impact on the CPI aggregation (Budsaratragoon and Jitmaneeroj, 2019).↩︎
The full list of administration’s responsibilities as well as its hierarchical structure could be found at IISSA (2024).↩︎
The IMEb (2023) offers municipal-level data on FDI stock, which is only available in a graphical format. Furthermore, even if extracted the data includes the organization’s own calculations which is not optimal for the empirical requirements of this study.↩︎
The use of FDI for the non-financial sector only has been determined by the available data, which does not include total inflows for all economic activities in the country.↩︎
For full description of the FDI variable collection method please see “Metadata and methodology” section in Foreign direct investments in non-financial enterprises at NSI (2021).↩︎
For full description of the variable see NSI a (2022)]↩︎
LIS (TIB, 2022) is an annual study measuring the anti-corruption capacity, political integrity, and transparency for various institutions within the Bulgarian municipal authorities.↩︎
The values given in NSI are in the domestic currency (levas) therefore to use the variable as a control for FDI inflows (which are given in euros) I transform it to an equivalent in euros. An exchange rate of 0.51 is chosen to estimate the new values.↩︎