
Introduction
An important feature of this paper is the exploration of the belief that students are characterized by their social nature and ability to make new friendships. The article compares two email networks and concentrates on their network structure of friendships.
Other Social Network Studies
Social network studies tend to be case studies of a single group or setting. Relatively less attention has been paid to comparisons using networks from multiple datasets and longitudinal comparisons. Studies employing multiple datasets focus on one of two distinct general questions. The first asks whether a network of a specific relational content, in aggregate, exhibits common structural tendencies. The second enquires as to what structural features are distinguished among different kinds of social relations. In approaching the first sort of question, some studies have examined the same relation measured in multiple settings. Empirical examples include friendships in schools or classrooms (Bearman, Jones, and Udry 1997; Hallinan 1989; and Leinhardt 1972).
Paul Holland and Samuel Leinhardt (1976) used triples or triad census counts to compare local structural similarities among a collection of fifty-one networks of different relational contents, measured on different species. Stanley Wasserman and Philippa Pattison (1996) compare the direction and magnitude of parameters (size, density, and connectedness) in networks using graphs, allowing the calculation of measures of dissimilarity between graphs for a variety of social networks. Both studies found differences in the “structural signatures” of different kinds of relations, notably antagonistic relations such as fighting and dominance on the one hand, and relations of affection (friendship, liking) and affiliation on the other.
Social networking techniques have been used equally effectively to compare the networks formed by other species, as well as to compare human networks with the networks of other species. John Skvoretz and Katherine Faust (2002) documented that humans show tendencies toward mutuality and in-stars and away from transitivity, compared to non-human primates, which showed tendencies in the opposite direction on these properties. Later the triad census approach was applied (2007) to study forty-two networks among four types of species, human, nonhuman primates, non-primate mammals, and birds. Faust and Skvoretz also introduced the technique of applying network analysis to study change across time. Their aim was to assess whether two, three… or many differing networks were similarly structured despite their surface differences. A recent study by Faust (2006) uses a triad census to compare different social networks of, amongst other species, chimpanzees; she comes to the conclusion that “caution should be taken in interpreting higher order structural properties when they are explained by local network features pg. 12”.
Research Question
This paper will investigate the following research questions.
-
To determine how email activity between staff within a university is separated between workflow and administration-based emails, compared with e-mail sent outside the university.
-
To determine if the email activity between staff and students mainly relates to teaching and learning.
-
To determine if emails between students on a university campus are mainly within year group and of a social nature by using qualitative interviews.
Research Methods and Data sets
This section describes the research methods and two data sets used in this paper and their sample sizes.
Data Analysis Methods
This study implements the “two-way” network comparison technique detailed in Stevens (2010). It details the output of these implementations by performing a “2 way” cross-sectional analysis on the email social network data.
The raw email contact data used in this paper was collected and anomized by Computer Service at the University of Essex. A random user identifier was assigned to all email users 1 . The processing of this raw data into useable data was performed using PERL computer programs. This data is then imported into UCINET and Netdraw computer packages for analysis. By its nature this is a complete sample of 50177 email sent by 2801 users.
The data collection technique is recoded in anomized log files, by means of which an individual’s emails that were recorded in a given one-week period. The computer service only provided me with the following information:
-
The department and user type assigned to each user identifier
-
The source user identifier and destination user identifier of all emails sent within the university in a given week
-
The number of users with email redirects.
For obvious legal and ethical reasons computer service only provided the following information for the research reported in this paper.
Staff email network
The first email friendship network I investigate is a University based staff network. By its nature this is a complete sample. The set has information on 1910 different members of staff who sent, or received email to other members of staff in a one-week period. In comparison with the student email network that I describe next, the email volume of the staff email network is less affected by term dates. This is shown below in Figure 1.
Figure 1:- Internal staff email volume by week (2582 staff with 110 redirects) (Source: Data collected by University of Essex computer service and detailed in X (19-20 February 2009))
The data points are limited as a result of SSPS graphs. The basic descriptive statistics of the staff email data set for a given week is shown below in table 1.
Table 1:Staff emails response rates
| No. Staff email originators | 1910 |
| No. Emails | 40071 |
| Average | 20.97 |
Student email network
The second email friendship network I investigate is a university based student email network. The set has information on 819 different students who sent email to other students or received email from other students, in a one-week period. Unlike the staff email network which I described previously, student’s attendance and the email volume of the student email network are affected by term dates. This is shown in Figure 2.
Figure 2:Internal student email volume by week (8591 students with 254 redirects) (Source: Data collected by University of Essex computer service)
The basic descriptive statistics of the student email data set for a given week are shown below in Table 2.
Table 2:Student email response rates
| No. Student email originators | 891 |
| No. Emails | 10106 |
| Average | 11.34 |
A descriptive analysis of a staff to staff email network
In this section I investigate the staff to staff email network in further detail. The results detailed in the following sections were produced using the UCINET network analysis package and the graphs using Netdraw social network drawing package. The graph below depicts the staff email network within the University and illustrates that it is far denser than the student email network described in the next section. Table 4 Highlights the very considerable variation the number of email contacts by the department in which a member of staff works.
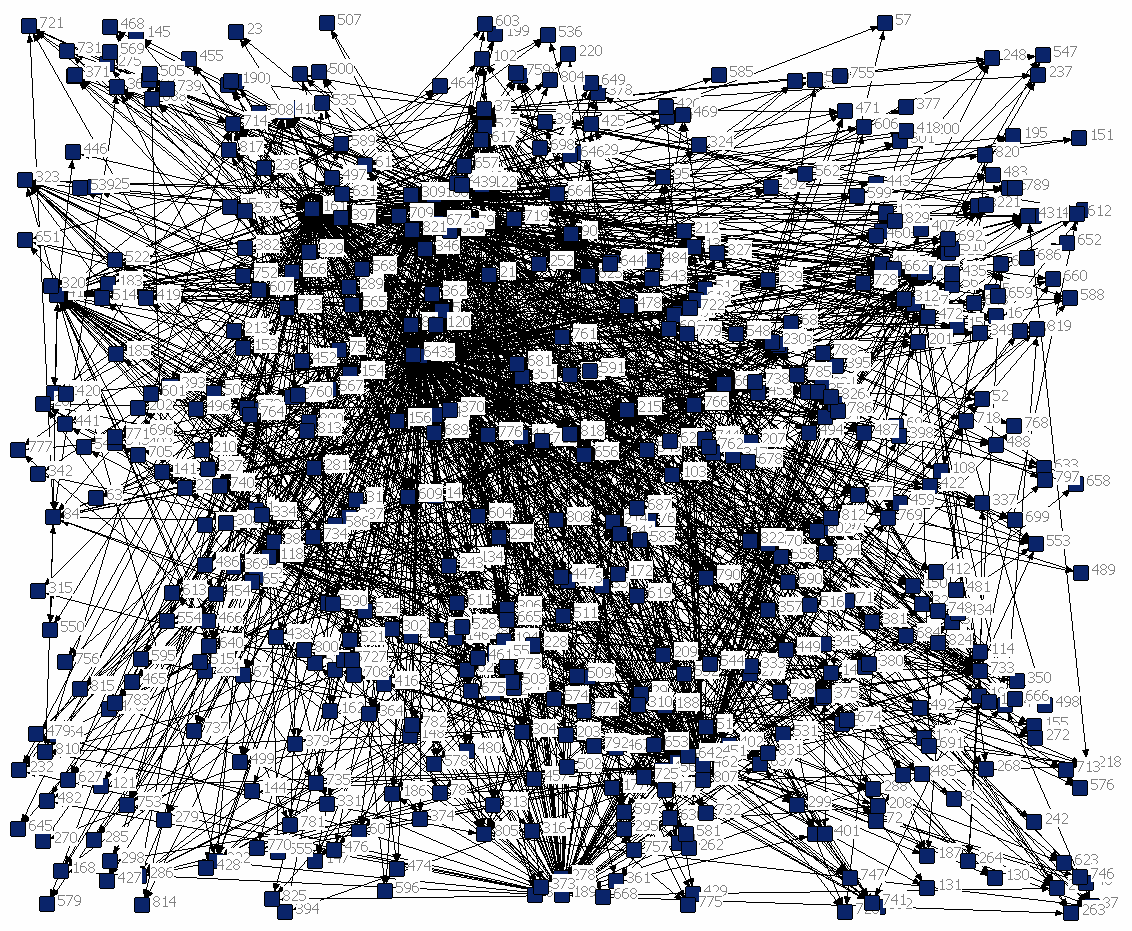
Departments
The volume of emails sent (out degree) by staff in each academic department within the University is shown in Table 4. (N = 40071)
Table 3:No of staff emails sent per department
| Department | No of Emails Sent | No of Staff | Average |
| Art history and theory | 403 | 25 | 16.12 |
| Biological science | 2068 | 147 | 14.06803 |
| Computing and electronics | 3059 | 147 | 20.80952 |
| East 15 | 712 | 81 | 8.790123 |
| Economics | 2057 | 41 | 50.17073 |
| Business school | 1755 | 101 | 17.37624 |
| Government | 1525 | 74 | 20.60811 |
| Health and human sciences | 1013 | 111 | 9.126126 |
| History | 738 | 31 | 23.80645 |
| International academy | 528 | 92 | 5.73913 |
| Language and linguistics | 1485 | 60 | 24.75 |
| Law | 1606 | 80 | 20.075 |
| Literature | 1386 | 52 | 26.65385 |
| Mathematics | 514 | 23 | 22.34783 |
| Philosophy | 104 | 19 | 5.473684 |
| Psychology | 2138 | 52 | 41.11538 |
| Sociology | 1189 | 65 | 18.29231 |
I found that members of staff in science and engineering departments, and the business school, sent the most emails to each other, staff in the social sciences sent a moderate number of emails, and staff in the arts and humanities sent the least. It could be argued that the volume of emails and density of a network or subnet are one good indicator of the level of interconnection within that network, although of course they could be using other methods of communication.
Staff type
The volume of emails sent (out degree) by staff type within the University is shown in the following table. (N=40071)
Table 4:No of staff emails sent per employee type
| Employee Type | No of Emails Sent | No of Staff | Average |
| Academic | 22280 | 760 | 29.31579 |
| Administration / Support | 17791 | 892 | 19.94507 |
It can be seen from Table 5 that the largest number of internal emails were sent by academic staff, but administrative and support staff also sent a large number of emails within the university. Academic staff sent only slightly more emails than support staff within the department despite there being a ratio of approximately one member of support staff in a department, to 8 members of academic staff. I surmise and have anecdotal evidence that academic staff use email to contact students for teaching and external to the University to liaise with other users about research, but these points are not accessible given the confidentiality constraints in this research.
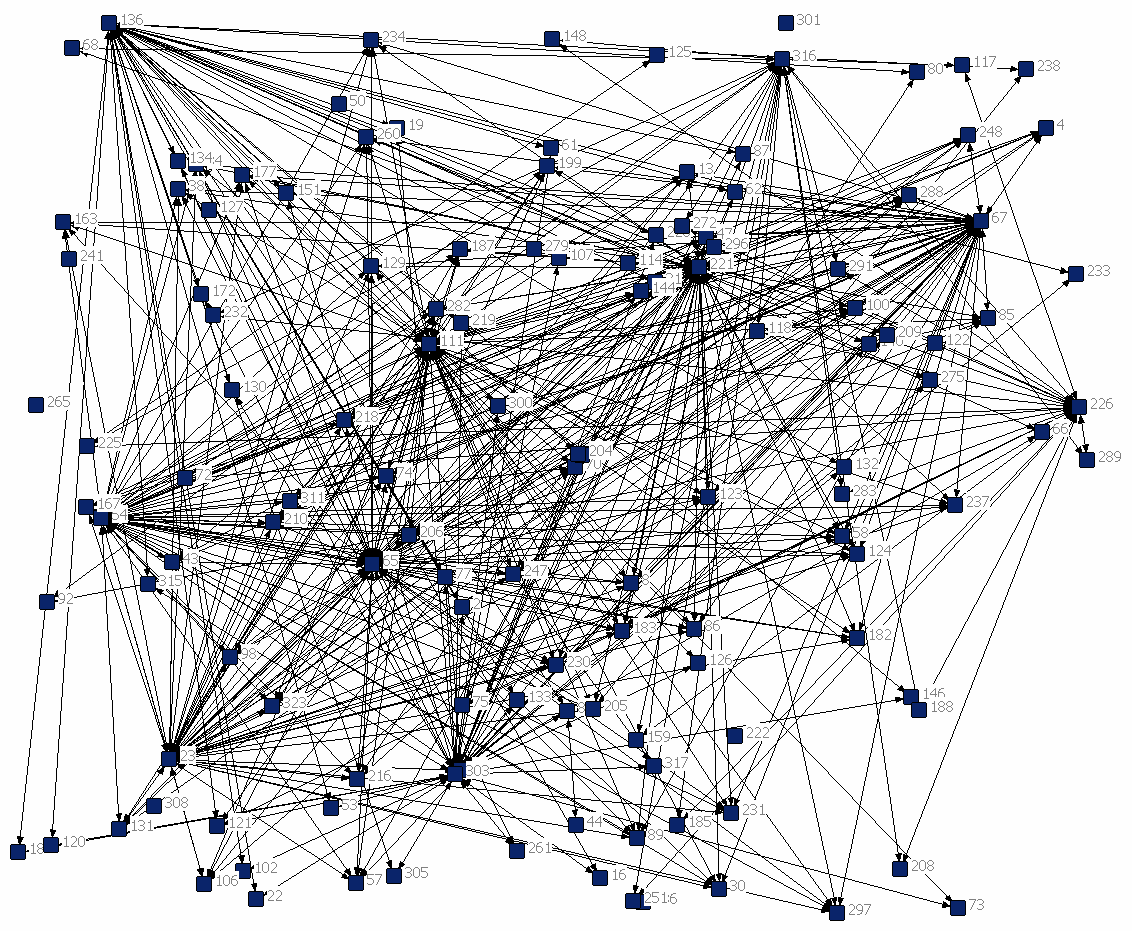
A descriptive analysis of student-to-student email network
In this section I propose to examine the student-to-student email network in further detail. Figure 4 shows a plot of the email network for a given week which illustrates it to be far less dense than the staff email network. The cluster of email respondents within the network that relates to the student’s department is clearly shown.
Department
The volume of emails sent (out degree) by students in each academic department within the University is shown in Table 6. (N=10106)
Table 5:No of student emails sent (according to student’s department)
| Department | No of Emails Sent | No of Students | Average |
| Art History and Theory | 30 | 133 | 0.225564 |
| Biological Sciences | 286 | 1007 | 0.284012 |
| Business School | 128 | 1638 | 0.078144 |
| CCFEA | 400 | 60 | 6.666667 |
| Computing and Electronic Systems | 119 | 616 | 0.193182 |
| Economics | 92 | 690 | 0.133333 |
| Government | 383 | 554 | 0.691336 |
| Health and Human Sciences | 258 | 1020 | 0.252941 |
| History | 288 | 442 | 0.651584 |
| Humanities | 115 | 950 | 0.121053 |
| ISER | 49 | 27 | 1.814815 |
| Language and Linguistics | 75 | 678 | 0.110619 |
| Law | 6408 | 899 | 7.12792 |
| Literature | 220 | 507 | 0.433925 |
| Mathematics | 24 | 167 | 0.143713 |
| Psychoanalytical Studies | 47 | 151 | 0.311258 |
| Psychology | 75 | 547 | 0.137112 |
| Sociology | 1111 | 361 | 3.077562 |
It can be seen from Table 6 that by far the highest number of internal emails were sent by students within the law department. Students in the arts department sent far fewer emails. It is surprising that there is very little variation in the number of emails sent by students from different departments, and little variation in the density of the network within departments. The density of a network or subnet is a very good indicator of the level of interconnection within that network.
Student type
The volume of emails sent (out degree) by student degree level within the University is shown in Table 7.
Table 6:No of student emails sent per student type (Source: Calculated using bespoke Pearl computer programs)
| Student Type | No of Emails Sent | No of Students | Average |
| 1st year Undergraduate | 13 | 2995 | 0.004341 |
| 2nd year Undergraduate | 763 | 2532 | 0.301343 |
| 3rd year Undergraduate | 1167 | 1824 | 0.639803 |
| Post graduate (taught) | 6445 | 1986 | 3.245217 |
| Post graduate (Research) | 1718 | 1285 | 1.336965 |
Qualitatively I have found by interviewing five students that emails between students on site are mainly within year group and mainly of a social nature. I also found that student emails off site are mainly regarding contacts back home and keeping in touch with past friendships. I have no quantitative data to support this supposition.
The student email network is a less dense and interconnected acquaintanceship network than the staff email network with markedly fewer emails sent by younger students (i.e., undergraduates) because they use email accounts outside the university, a lot of which they will have been using since there childhood. In contrast, post graduate students use email accounts within the university.
Comparing staff and student email networks
In this section I compare the staff and student email networks using multidimensional scaling of the network data. Firstly I briefly compare the number of staff-to- student and student-to- staff email networks for completeness.
It is a widely held view that an educational establishment such as university is a small community of its own. This study found that, in terms of email activity, this university appears to have two separate communities of staff and students. This result is not surprising because the division between staff and students was assumed at the start in the research question and in the method. The study does however, show that these two groups use emails in different ways. Investigating staff-to-student and student-to-staff e-mails, this study found that these forms of email traffic with the given sender and recipient pairs, and I assume this is virtually exclusive for teaching and learning for research and taught courses alike. The volume of emails sent differentiated by email sender type is shown in Table 2.
Table 7:Number of emails sent, by direction (student-to-staff and staff-to-student)
| Direction of email traffic | Student | Staff |
| Student | 10106 | 1056 |
| Staff | 66840 | 40071 |
As can be seen from the table the pattern is very biased toward staff sending emails, which is mainly for the purpose of sending teaching materials to students and only a minimal number of emails are sent in the reverse direction from student to staff. This email activity is mainly within the students own department.
Metadata Table
Table 9 compares these two email networks, which have a vastly different number of nodes. The staff network has grown in an organic fashion over 25 years of email use in the university. In contrast, the student network has a turnover of students, on average, every two years. For this reason the staff network is rather denser and more centralised than the student network, and has a smaller path length than the student network. The student social network is more scattered in layout than the staff social network. In the student network, an Individual’s friends are rather more local and in a more isolated student situation rather than outside of the university, but are still within the United Kingdom.
Table 8:Comparing University staff and student email networks (Source: Calculated using UCINET using staff and student email datasets)
| Data set | No. of nodes | Density the of social network, Bott (1957) | Average Shortest Path, Scott (1991) |
Network % centralization Freeman 1992) |
Node Betweeness, Freeman (1996) |
|
Staff email network |
324 | 0.0118 | 4.442 | 18.06 | 1027.264 |
| Student email network | 833 | 0.0051 | 3.618 | 4.88 | 221.775 |
The main thing that this network comparison highlights is that there are two different networks or communities, staff and student, co-located in the same location of a University.
Results
Elaborating the results of the Prefscal procedure shown in Figure 5 by highlighting the nodes produced a graphical output to compare the social networks when the outputs are combined together. This procedure has the notable advantage that the user can select to output rows or columns in the model space and use a rectangular input data matrix. However, this output is unsatisfactory, providing no additional information except that the networks are different. The source data of the Prefscal output (Table 9) is more revealing, showing that Network 1 is more developed than Network 2.
section I found that a multi data set comparison cannot be successfully used to compare cross-sectional social network data sets. This new method of analysis detailed in Stevens (2010) only shows that the two networks are different. It can be concluded from this analysis that this new method of analysis should not be used for comparing two networks.
Summary
I assume that the emails used by staff within a university are predominantly for work, with staff performing either teaching or administration based tasks by email. Email is more of a social network and learning orientated tool for undergraduate students and the same is true to a lesser extent for postgraduate students. The email activity between staff within the university is mainly workflow and administration based and also to a lesser extent research emails, as research contacts tend to be outside the University. The email activity between staff and student is mainly regarding teaching and learning. Emails between students on site are mainly within year group and largely social in nature. Student emails off site are mainly regarding contacts back home and keeping in touch past friendships.
Bibliography
Bearman, PS., Jones, J., and Udry, J. R. (1997) Connections Count: Adolescent Health and the Design of the National Longitudinal Study of Adolescent Health .Bott, E. (1957). Family and Social Networks . London: Tavistock.
Faust, K. (2006) Comparing social networks: Size, density and local structure. Metodološki Zvezki, Advances in Methodology and Statistics, 3(2):185-216 .
Faust, K. & Skvoretz J. (2007) Comparing Networks Across Space and Time, Sizes and Species Pages. Sociological Methodology, 32: 267-299
Freeman, L.C. (1992). The Sociological Concept of `Group': An Empirical Test of Two Models. American Journal of Sociology , 98: 55-79.
Freeman, L.C. (1996). Some Antecedents of Social Network Analysis. Connections , 19: 39-42.
Hallinan, M. (1972). Comment on Holland and Leinhardt. American Journal of Sociology , 77: 1201- 1205.
Hallinan, M.T. & Wilson, R.A. (1989). Interracial Friendship Choices in Secondary Schools. American Sociological Review, 54: 67-78.
Holland, P.W. & Leinhardt, S. (1976) Local structure in social networks. Sociological methodology , 7: 1-45
Scott, J. (1991). Social Network Analysis . London: Sage.
Stevens, J., (forthcoming) (2010), Comparing Social networks: Comparing Multiple Social Networks using Multiple Dimensional Scaling. Methodological Innovation Online , 4.
Stevens, J., (19-20 February 2009), One weeks staff email traffic: A data collection report. Annual (residential) Graduate Conference, Sociology Department, University of Essex.
Wasserman, S. & Pattison, P. (1996). Logit models and logistic regression for social networks: I. An introduction to Markov graphs and p*. Psychometrika , 61 : 401-425.
©John Stevens. This article is licensed under a Creative Commons Attribution 4.0 International Licence (CC BY).
-
This research was completed in keeping with the Data Protection Act (1988) and no content of emails was provided to me at any point in this research. ↩